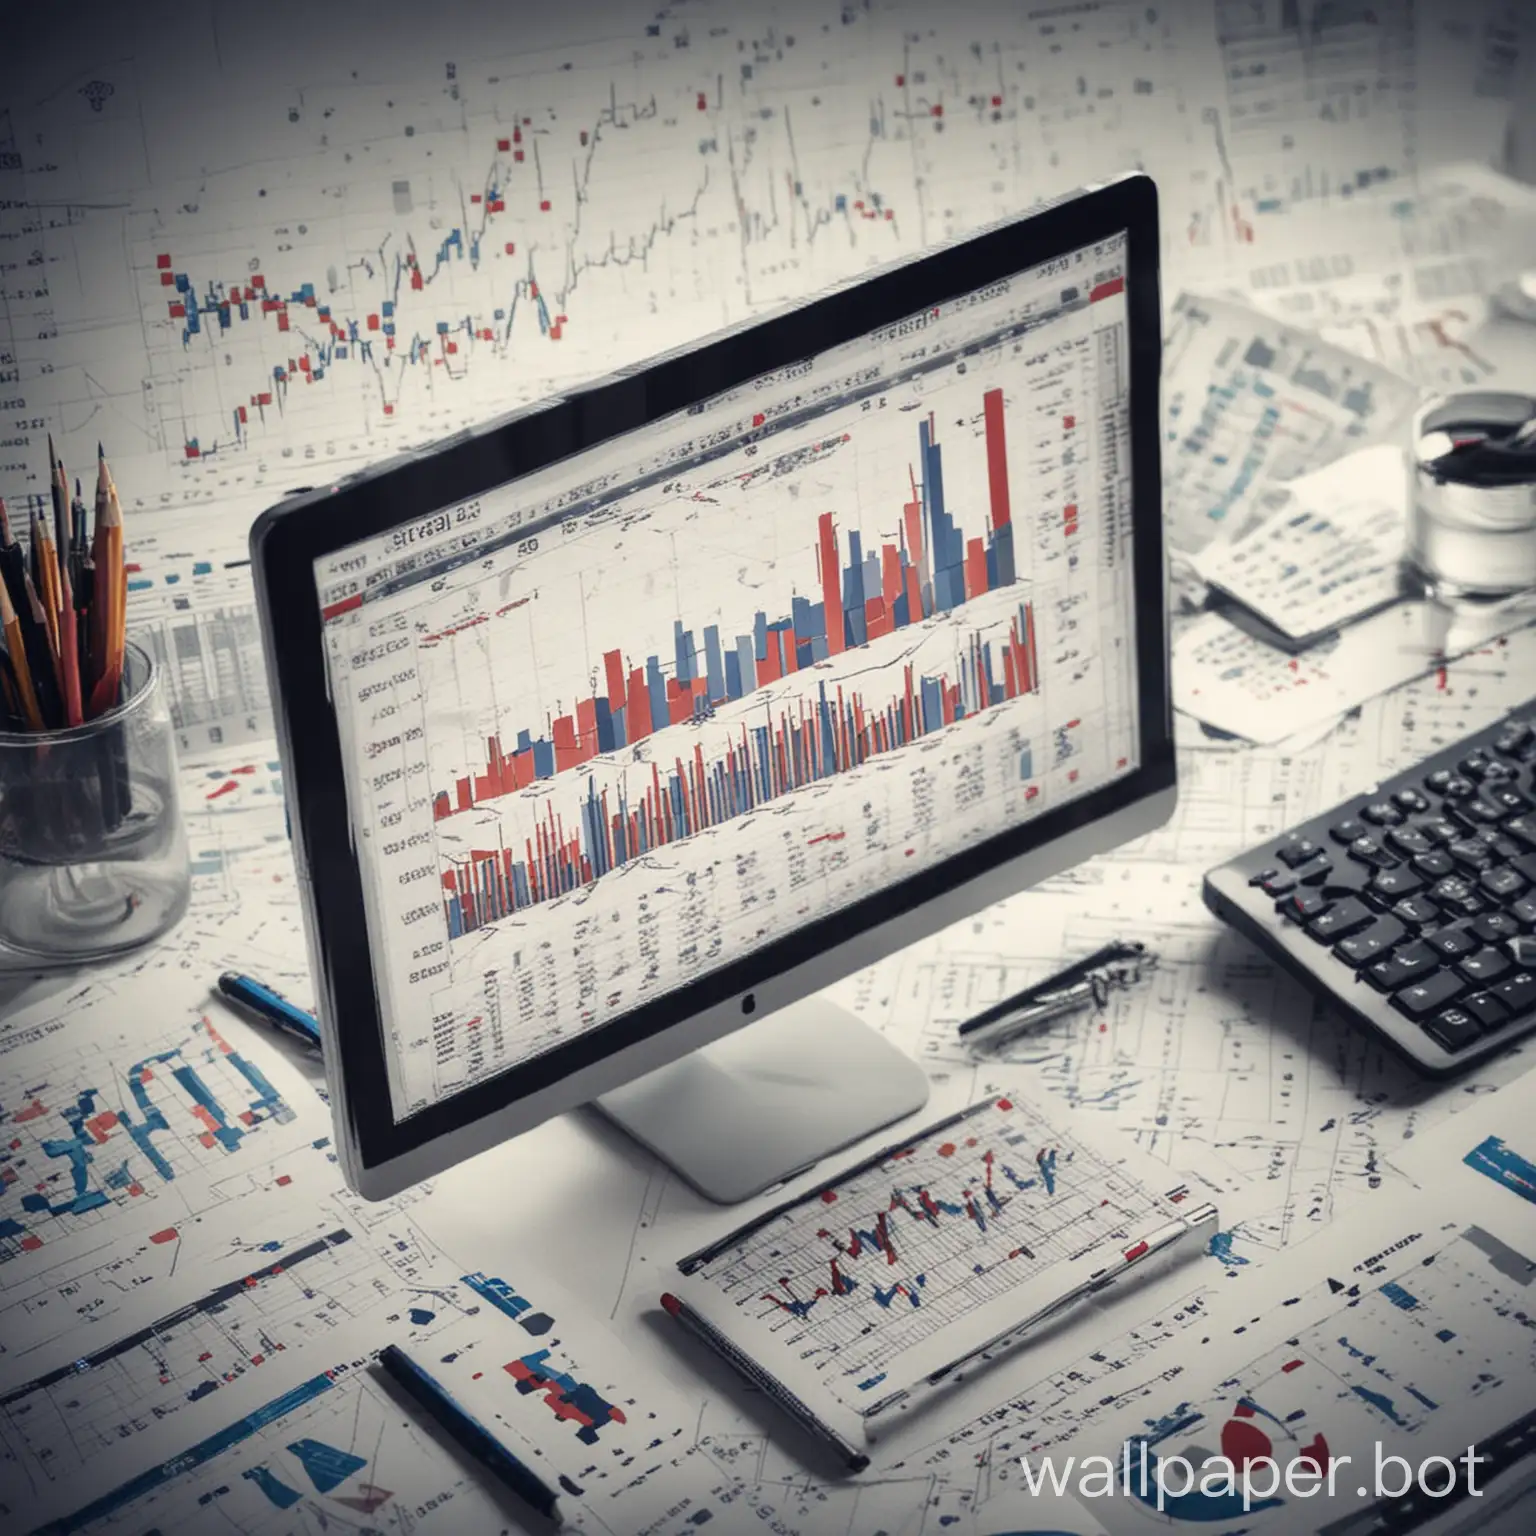
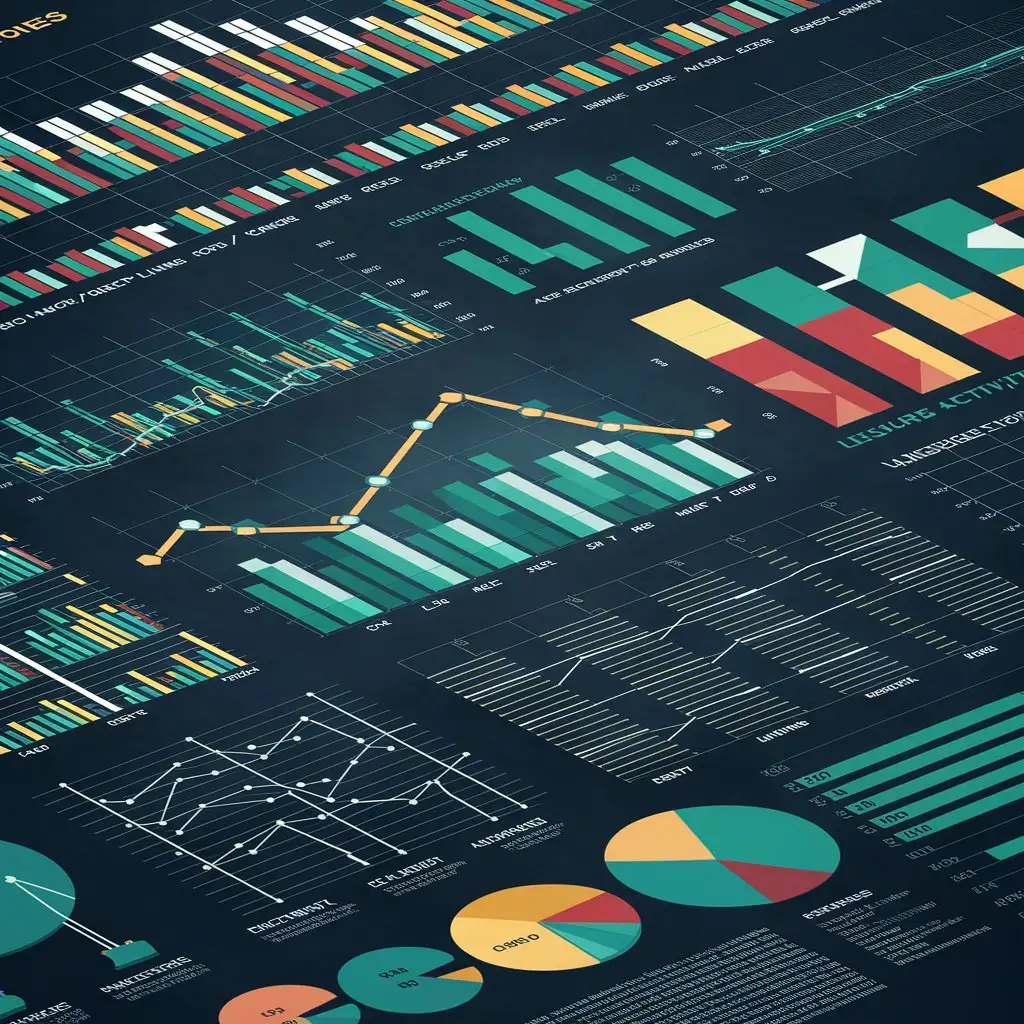
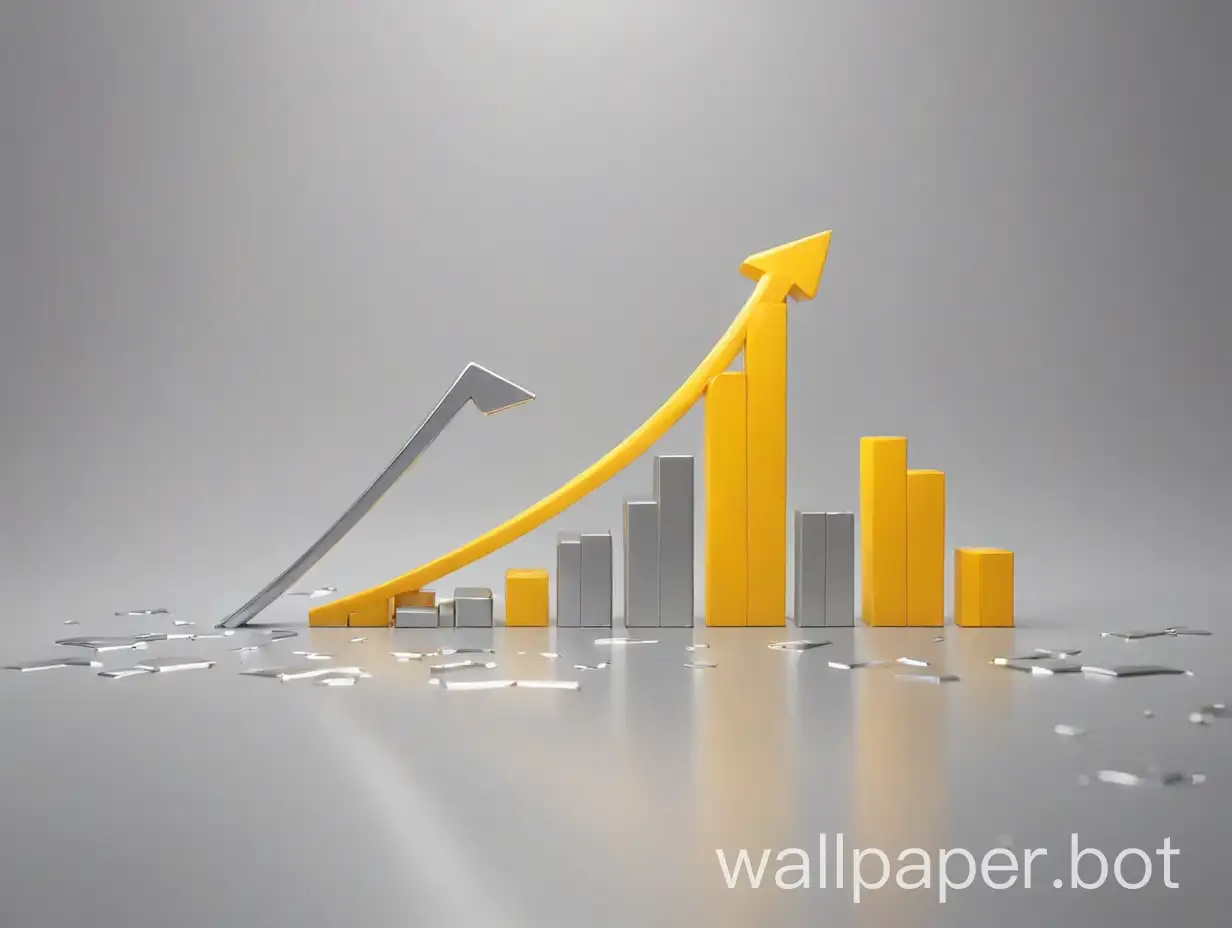
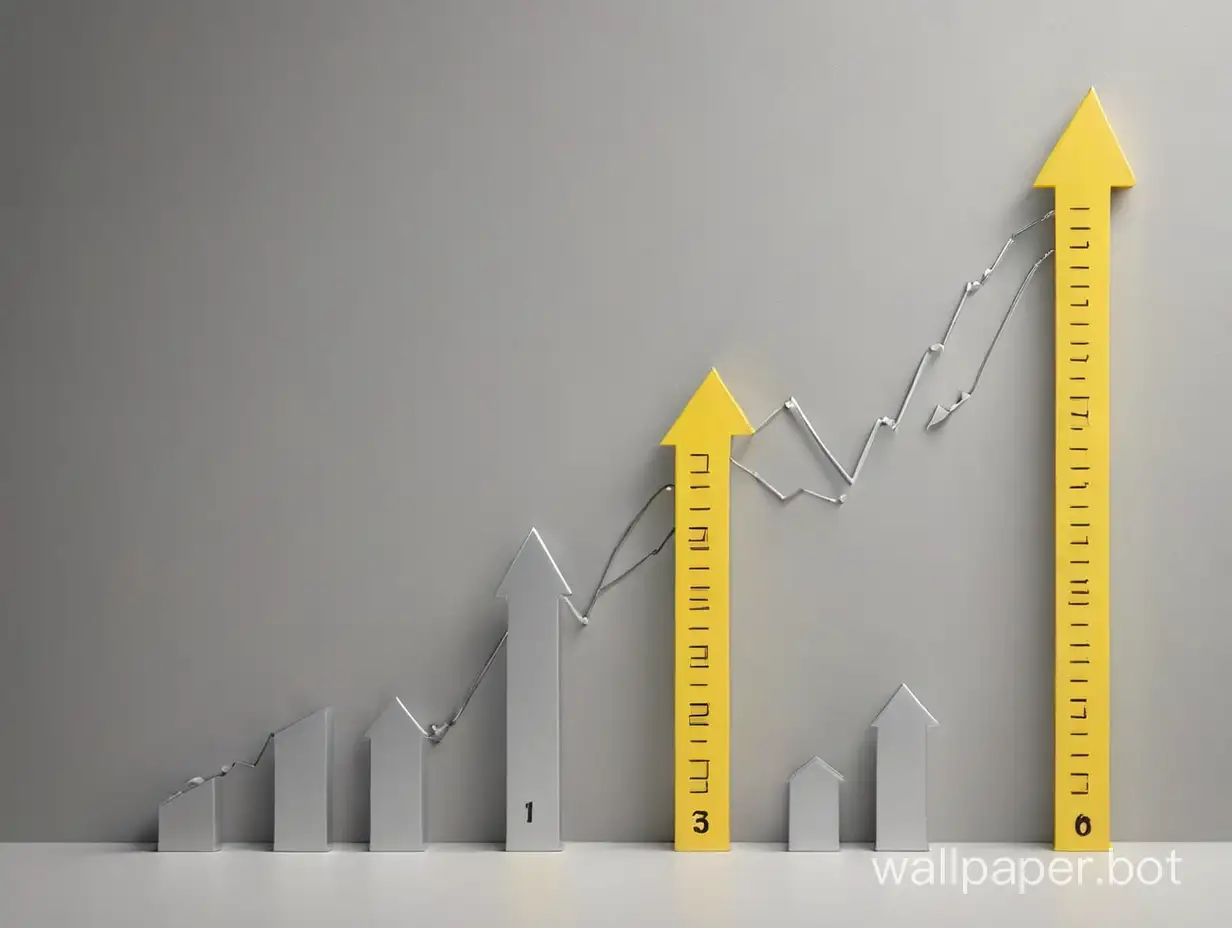
Revolutionary Data Charts Visualizing Information in a New Era
AI Wallpaper Prompt
Prompt
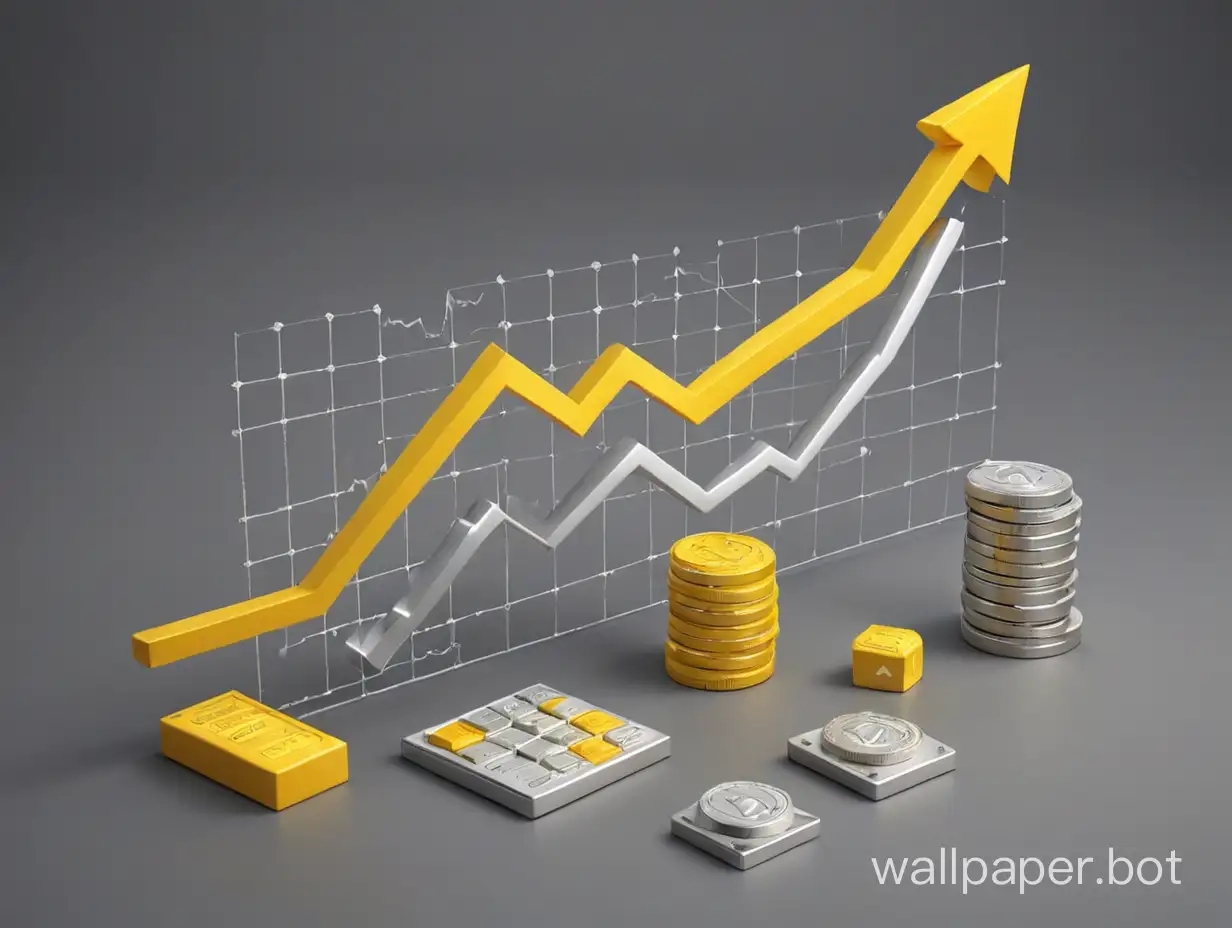
data charts in a revolutionary setting
Model: realistic
Ratio: 1:1
Related AI Images


Related Tags
AI Wallpaper Prompt Analysis
- Subject: The focal point of this image is data charts, indicating a depiction of statistical information or analytics. These charts could range from bar graphs to pie charts, representing various data sets. Setting: The setting is revolutionary, suggesting a futuristic or cutting-edge environment. This could include elements like advanced technology, sleek design, or innovative architecture, creating a sense of progress and innovation. Background: The background might feature elements that symbolize change or transformation, such as abstract patterns, futuristic cityscapes, or revolutionary symbols. It could also incorporate digital interfaces or data visualization tools to reinforce the theme of information technology. Style/Coloring: The style may lean towards modern or minimalist, with clean lines and geometric shapes to enhance readability. Colors could be vibrant and dynamic, reflecting the energy of progress and innovation. High contrast might be used to draw attention to key data points. Action or Items: The image could feature individuals or AI interacting with the data charts, analyzing information, or discussing insights. Alternatively, it might focus solely on the charts themselves, highlighting their significance and impact. Costume or Appearance: Characters depicted could wear attire that reflects a blend of professionalism and technological sophistication, such as sleek business attire with futuristic elements or high-tech accessories. Accessories: Accessories might include futuristic gadgets like augmented reality glasses, holographic displays, or digital tablets, emphasizing the integration of technology in data analysis and decision-making.