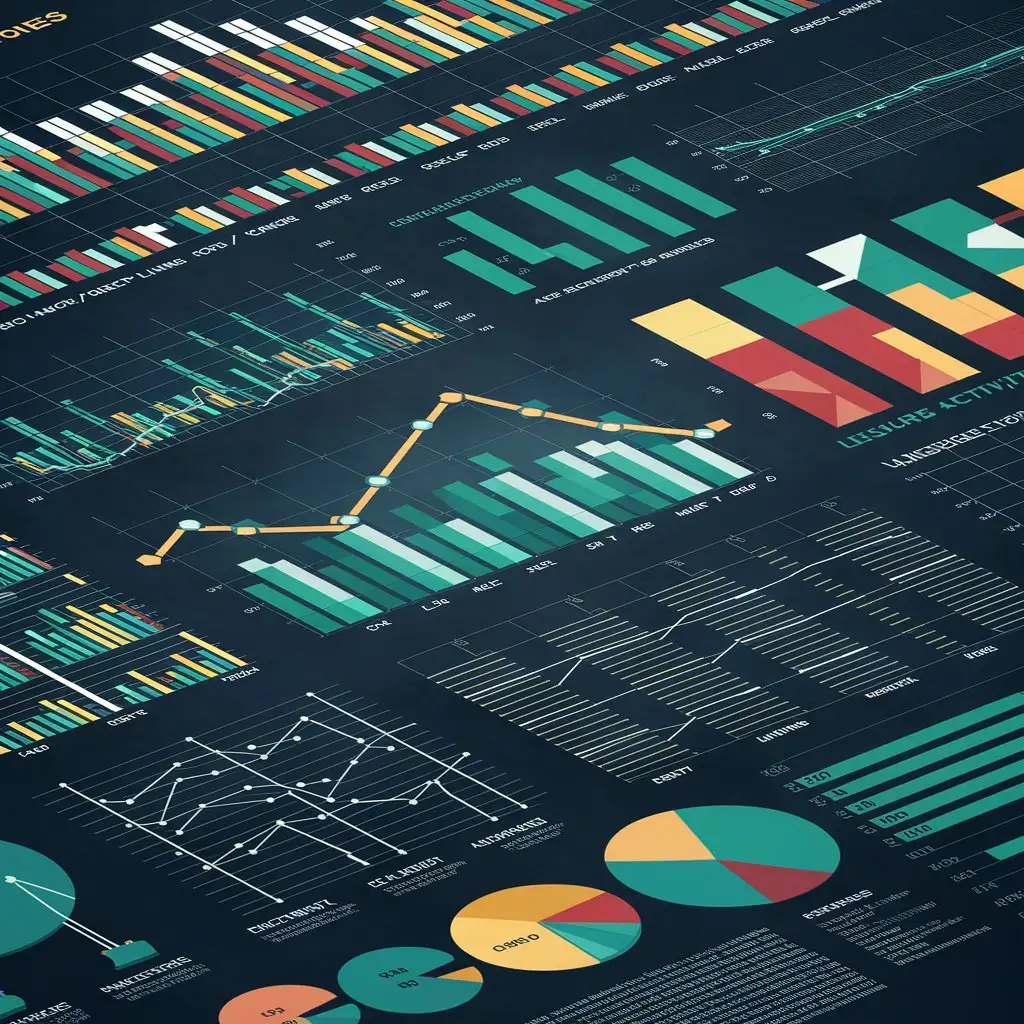
Comprehensive Expense Analysis Diverse Graphs Visualizing Spending Habits
AI Wallpaper Prompt
Prompt
Create a visually engaging image featuring a diverse array of graphs portraying expenses. Include bar graphs, line graphs, and pie charts to represent different expenditure categories such as groceries, dining out, fuel, rent/mortgage, utilities, leisure activities, and other miscellaneous expenses. Ensure each graph is labeled clearly and color-coded for easy interpretation. Additionally, vary the scales and styles of the graphs to add depth and interest to the composition. The overall presentation should be professional, informative, and visually appealing, providing a comprehensive overview of spending habits."
Model: visiCanvas
Ratio: 1:1
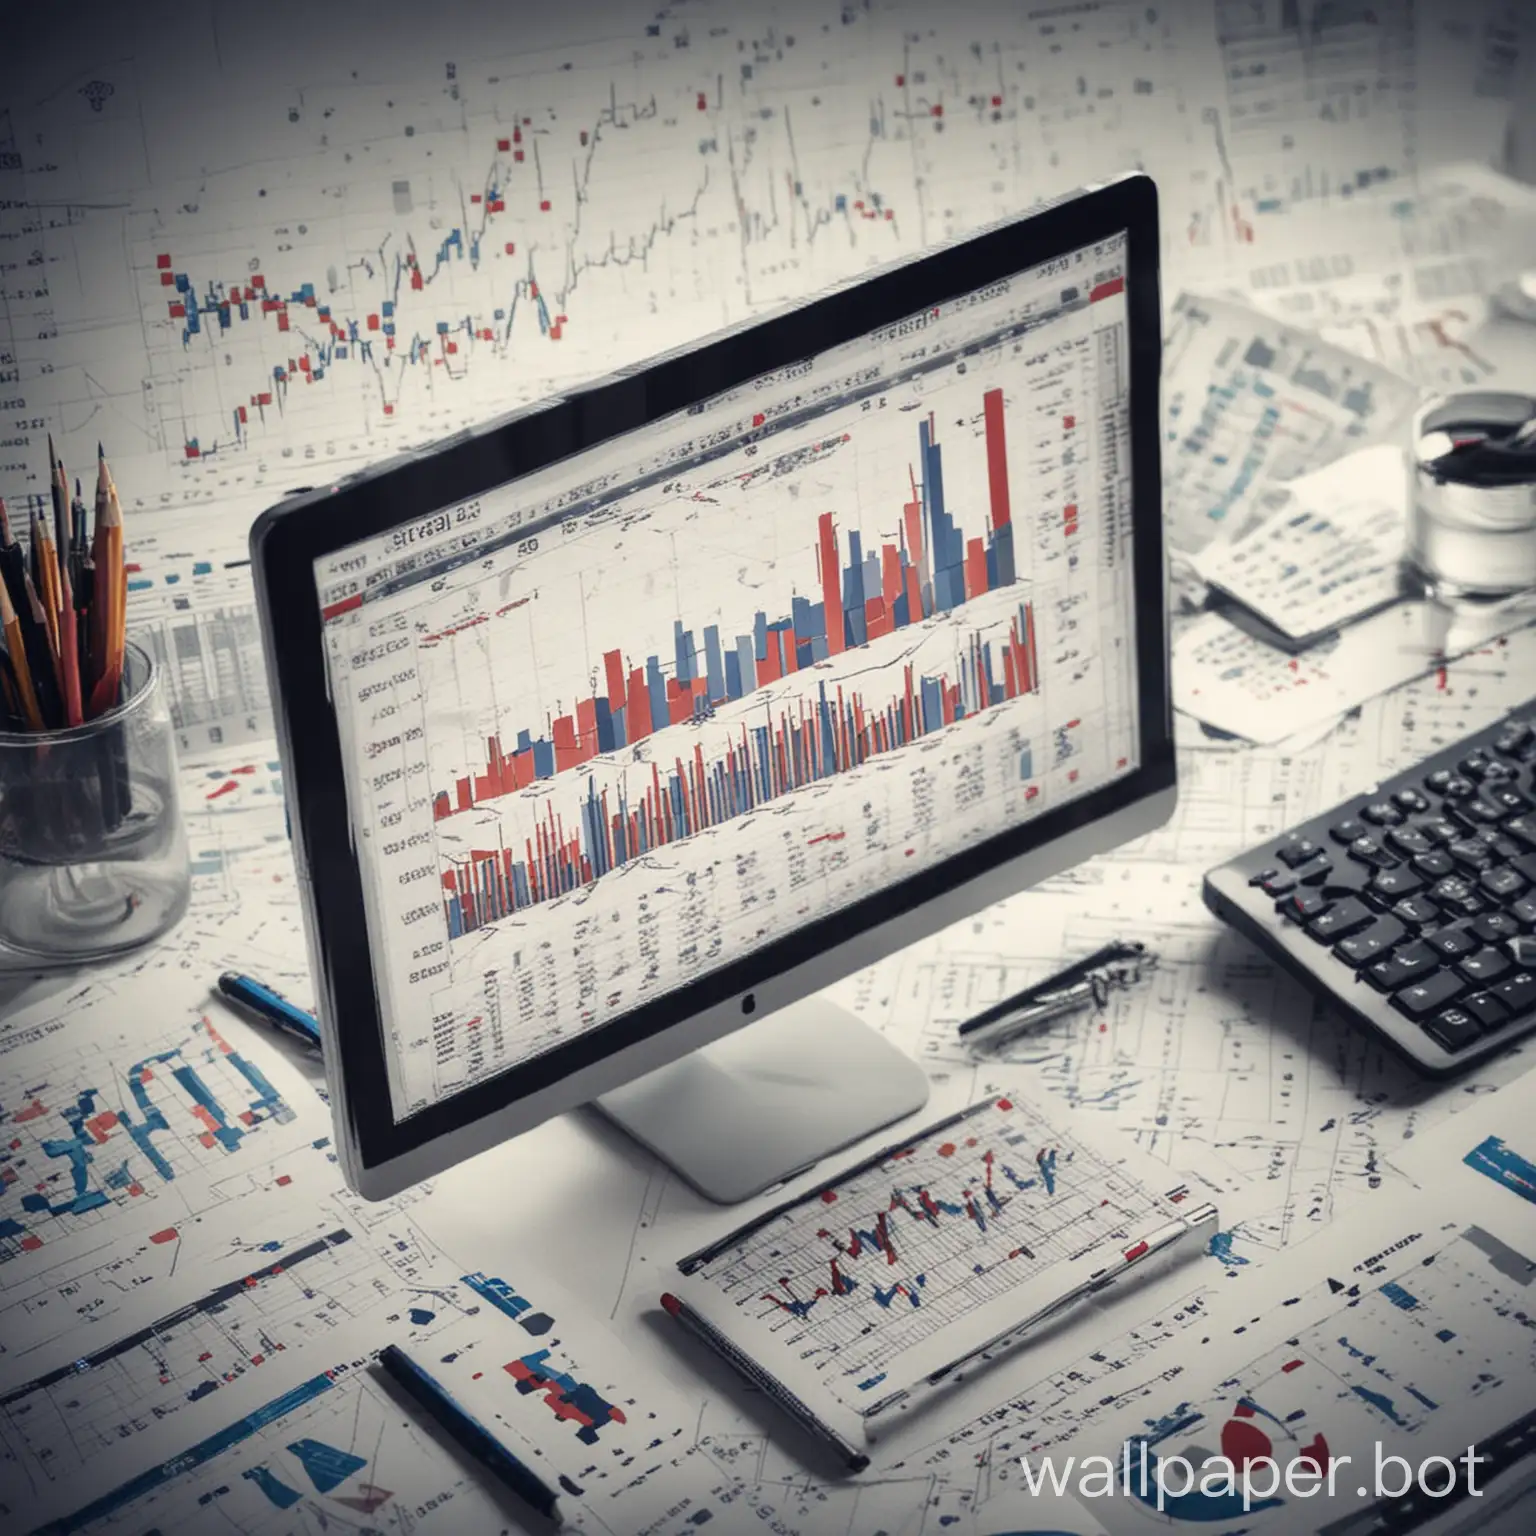
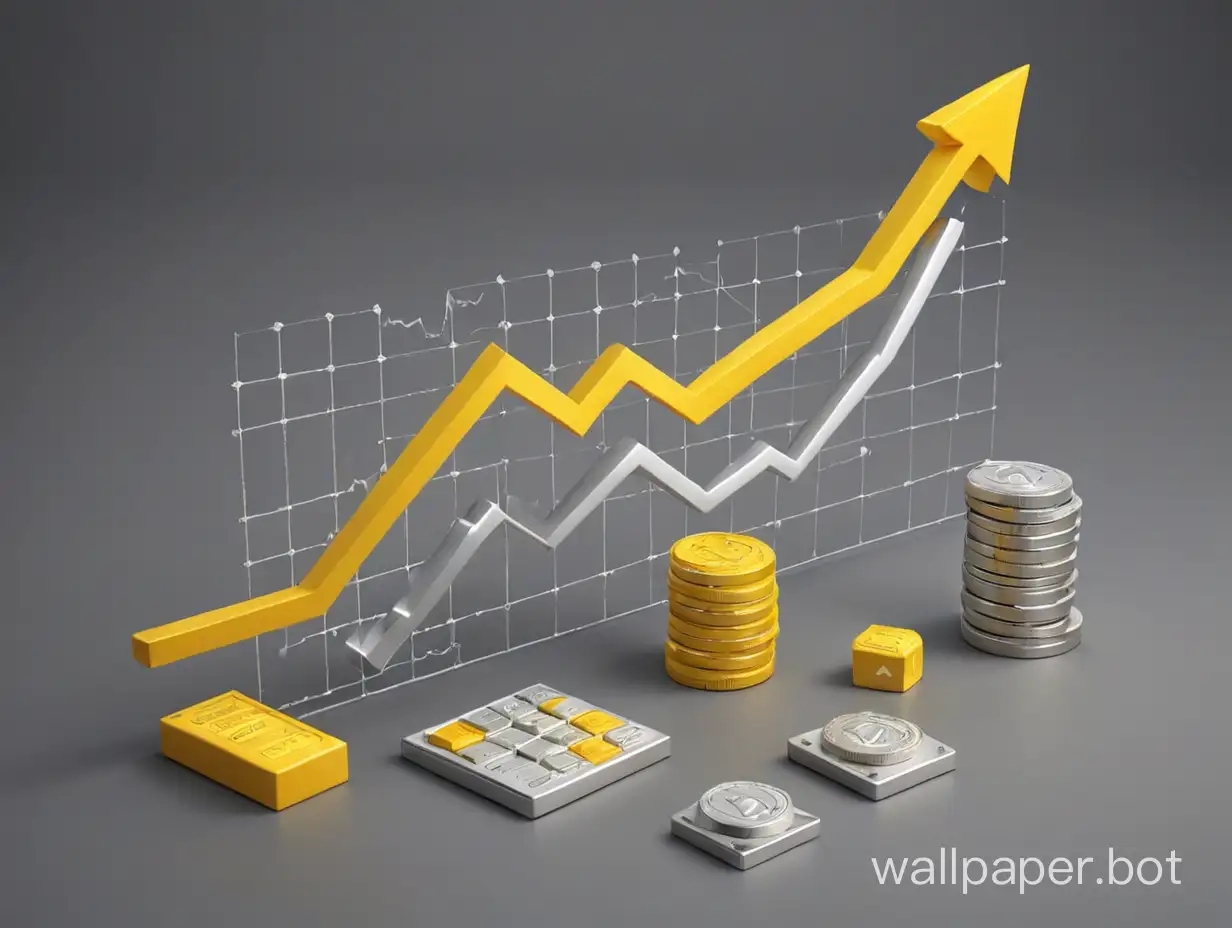
Related AI Images


R


Related Tags
AI Wallpaper Prompt Analysis
- Subject: The main subject of the image is a diverse array of graphs portraying various expenses. These graphs include bar graphs, line graphs, and pie charts. Setting: The setting is likely a neutral background, such as a white or light-colored backdrop, to emphasize the graphs and their data. It may also include subtle visual elements, like grids or axes, to aid in interpretation. Style/Coloring: The style of the graphs should be clean and professional, with clear labels and distinct color-coding for each expenditure category. Vibrant colors can be used to make the graphs visually appealing while ensuring they remain easy to read. Action or Items: The main action in the image is the visualization of spending habits through the graphs. Each graph represents a different expenditure category, such as groceries, dining out, fuel, rent/mortgage, utilities, leisure activities, and miscellaneous expenses. Costume or Appearance: As this is an image depicting data, there are no characters or costumes involved. However, the appearance of the graphs should be consistent and well-designed, with uniform labeling and styling across all categories. Accessories: The main accessories in the image are the labels, scales, and legends accompanying each graph. These should be clearly visible and positioned strategically to enhance understanding and interpretation of the data.